
Monitoring the Movement of an Exceptionally High Retaining Wall
February 2015
Monitoring a 75 m High Retaining Wall During Construction with a Deformation Monitoring System
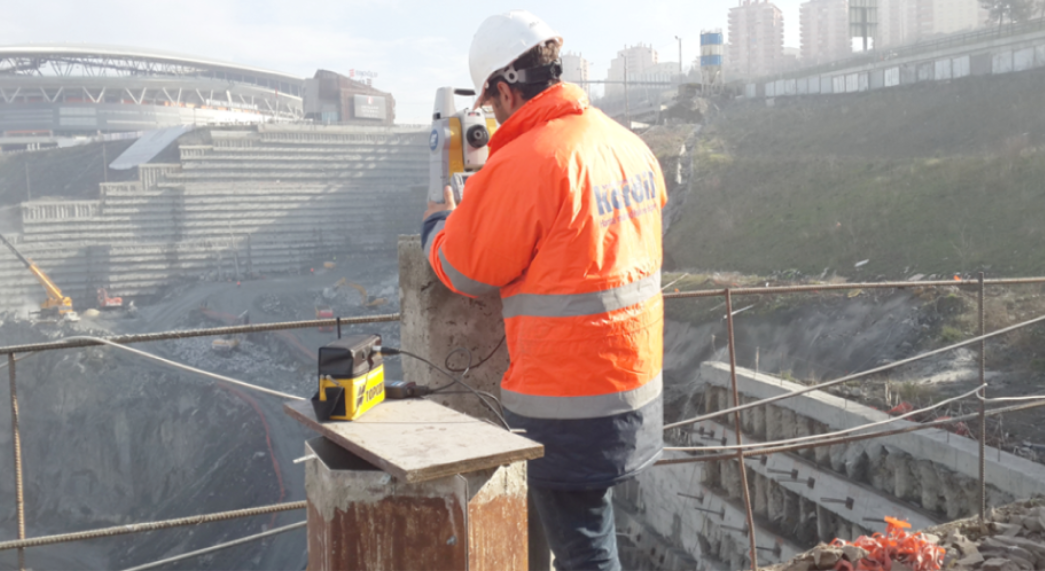
Work Carried Out by: Kordil Mühendislik Sanayi ve Ticaret Limited Şirketi
Cevizli Mah. Hızır Reis Sokak, No. 10, 34864 Maltepe, Istanbul
T: +90 (216) 344 68 35 F:
+90 (216) 461 05 79
Email: kurumsal@kordil.com.tr
Website: http://www.kordil.com.tr
Revision: 03, 14 February 2015
Introduction
This field report, revised in February 2015, describes the geodetic system installed to monitor retaining walls at a construction site beside Aslantepe Stadium. Prism observations tied to the reference network were adjusted, and displacements assessed in weekly reports. The methods and equipment are presented below with project records.
Project Workflow
- Site
- Establishing the geodetic infrastructure (external control network)
- Survey methods and equipment
- Data processing and computation
- Reporting
- Assessment of supplementary monitoring points
Site
The site is the area enclosed by the green boundary in the satellite image below. It adjoins Türk Telekom Arena on one side and the O2 (TEM) motorway on the other.
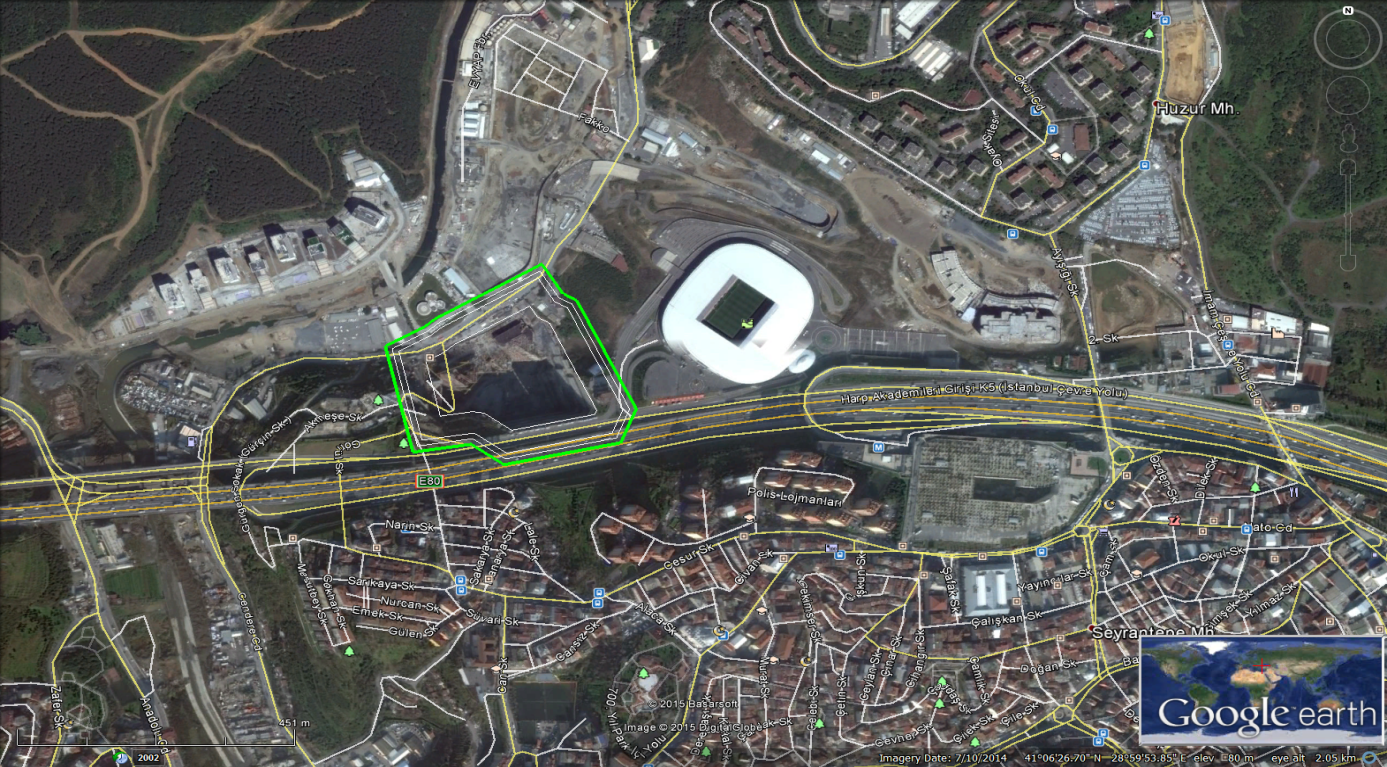
Satellite image of the site. The green boundary encloses the project area.
The vertical difference between the excavation and the motorway and stadium ground levels exceeds 70 m. The monitored structures are retaining walls surrounding the site, with heights ranging from 15 to 70 m.
The retaining walls comprise four main sections.
TEM side: 70 m
Mobilisation 1 side: 40 m
Mobilisation 2 side: 15 m
Stadium side: 65 m high.
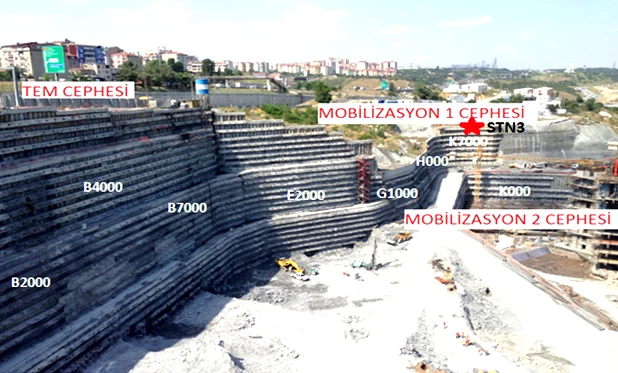
View of the site.
The photograph was taken from STN1 on the stadium side, one of the two observation stations. This side is known as the Stadium Side. Excavation was continuing at the future tower foundation. Eight monitoring axes on the TEM, Mobilisation 1 and Mobilisation 2 sides are identified in the image. Each axis comprises mini prisms mounted vertically on the retaining wall. The star marks the other observation station, STN3, above the Mobilisation 1 side.
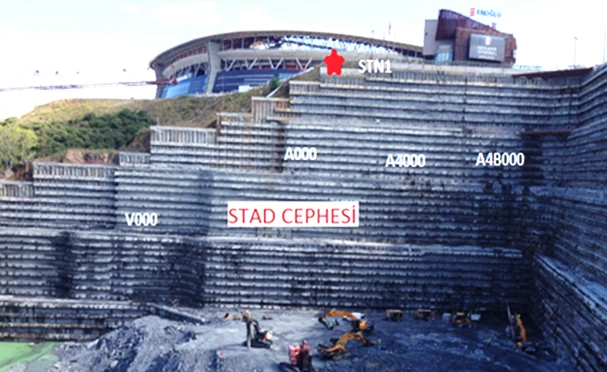
View of the site.
This photograph was taken from STN3, whose location is shown in the preceding image. It shows the monitoring axes on the stadium side and station STN1. Four axes on the stadium side are identified by name and location.
Establishing the geodetic infrastructure (external control network)
Five control points were established outside the site in suitable locations where deformation was expected to be minimal. They were precisely surveyed to provide the reference for all observations. Industry-standard, simultaneous static GNSS sessions tied the points to the national geodetic network. Reference prisms were installed on all five points.
Reference prism locations were selected carefully, taking account of how the ongoing residential and hotel construction could affect the site.
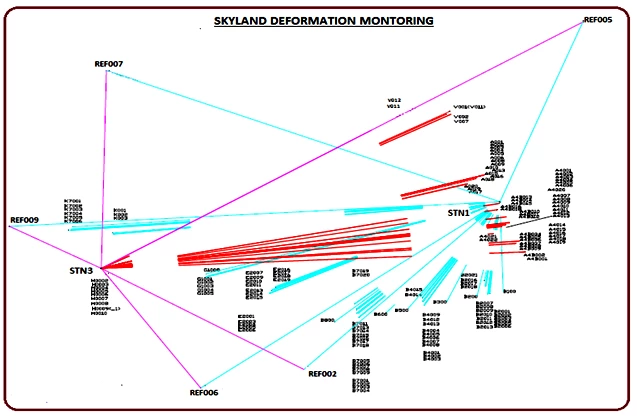
Computer-generated survey network diagram.
The diagram shows the principal stations STN1 and STN3, the five reference points (REF002, REF005, REF006, REF007 and REF009) used to determine their positions at the start of each survey, and the monitored mini prisms.
Survey methods and equipment
A monitoring station and associated deformation monitoring software were used on this project. Survey accuracy depends on more than the instrument specifications: reference-network stability, observation geometry, atmospheric conditions and adjustment results must be assessed together.
The system consists of two principal stations (STN1 and STN3), five reference points (REF002, REF005, REF006, REF007 and REF009), and observations to 183 mini prisms installed on the retaining walls. From STN1 and STN3, each point is observed in both telescope faces to eliminate collimation errors. Every survey undergoes adjustment, with additional checks of angles and distances derived from the raw data.
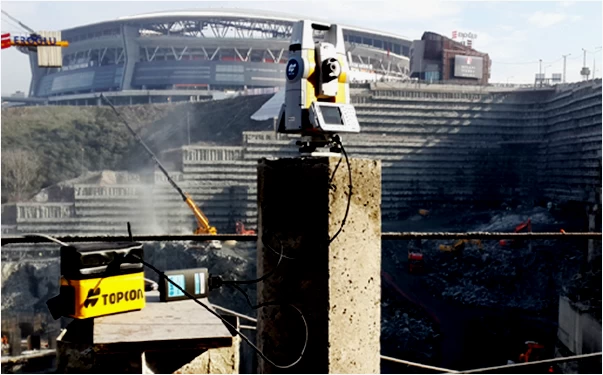
The monitoring station surveying from STN3.
The stadium-side wall observed from STN3 is approximately 40 m high in this image. Excavation for the tower was continuing. New mini prisms were added as the retaining wall progressed. Each new prism was included in the adjustment and added to the deformation record.
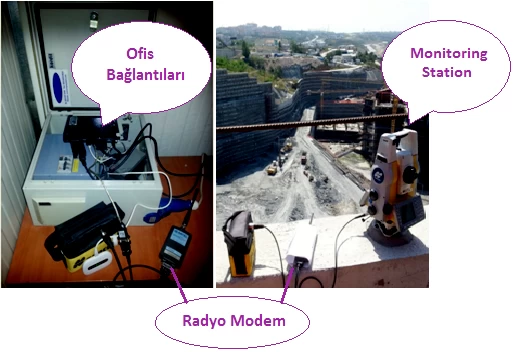
Illustration of the system's operating principle.
The system operates through two radio modems that exchange data. Portable batteries supply power, as shown. One modem connects to the office computer and the other to the monitoring station. The office software controls the monitoring station set up at STN1 or STN3 through this radio link.
Communication between the monitoring station and the computer is established and the software started. The station sights a reference point and is reoriented through the software. It then observes the reference points and recalculates its station coordinates at the start of every survey. This also checks whether the station itself may have moved. Mini prism observations begin after positioning.
Data Processing and Computation
Point coordinates were adjusted by least squares using a functional model of the angle and distance observations and a stochastic model defining their weights. Coordinates from different survey epochs were compared to calculate changes in the two horizontal components (dx, dy) and the vertical component (dz). The significance of displacement must be assessed together with the uncertainty of these differences.
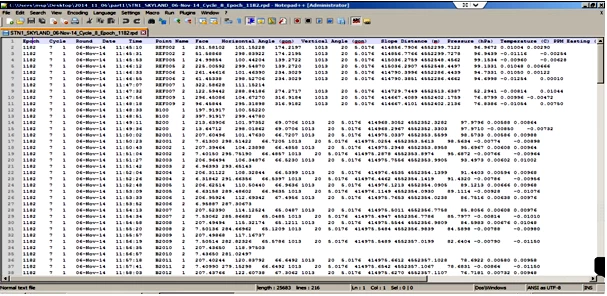
The image shows the raw observation file. The records contain horizontal coordinates and elevations, angles and distances, ambient pressure and temperature.
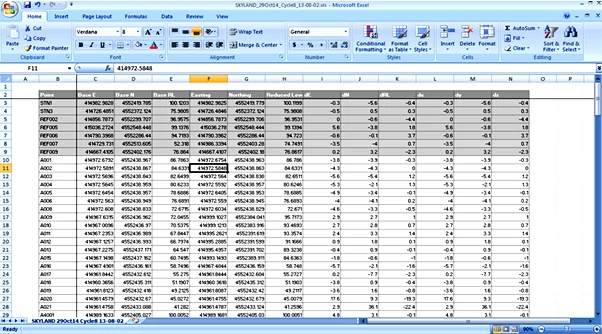
The image shows the file containing the final adjusted coordinates and the deformation values dx, dy and dz derived from them.
Analysis in the coordinate axes alone is insufficient to describe inward and outward movement, bulging or cracking of retaining walls under internal and external forces. Therefore, the horizontal movements dx and dy are rotated using the direction angle between the station and the observed prism.
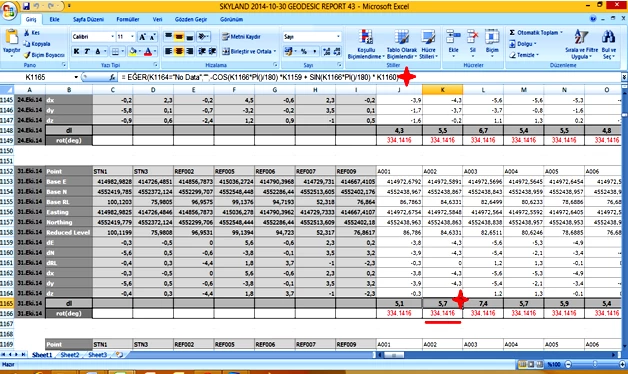
The star marks the rotation formula and angle used.
Reporting
A graphical record was prepared for each axis from the start of the project, incorporating the weekly deformation analyses. The plots allowed movements of the retaining walls to be followed by week, month and year. The weekly report was presented to the responsible management units at the regular Friday meeting.
Example of axis K000 on the Mobilisation 2 side, where monitoring ended on 19 September 2014 because the rising structure in front obscured the retaining wall:
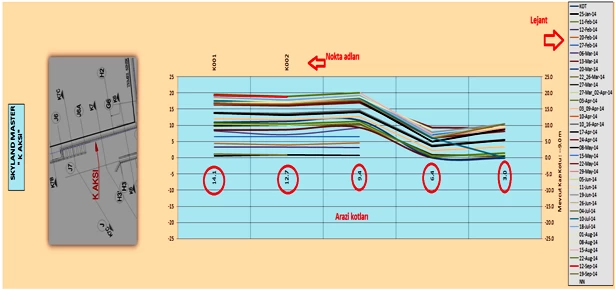
The image shows the deformation model for axis K000 on the Mobilisation 2 side.
Observations of K000 began on 25 January 2014 and ended on 19 September. The image shows deformation over approximately eight months. At the end of that period, movement had reached about 2 cm in the forward direction.
The plot includes the axis location, mini prism names, current excavation level and a legend to aid interpretation. The graphical scale uses 5 mm intervals. Dated legends and a different colour for each epoch allow weekly, monthly and yearly comparisons.
The approximate 1 cm and 2 cm values in the plot relate to the respective observation periods. Extrapolating the first four months linearly into the next four does not provide a reliable deformation forecast; excavation, loading, groundwater and support conditions may change. Forward-looking assessments must combine current observations with geotechnical investigation.
Supplementary Monitoring Points
The direct connection and frontage of the Skyland Istanbul project to the O2 TEM motorway make the location particularly sensitive. The report identifies the 60 m high TEM-side retaining wall as a concern for potential ground movement beneath the main road. The road therefore also required monitoring.
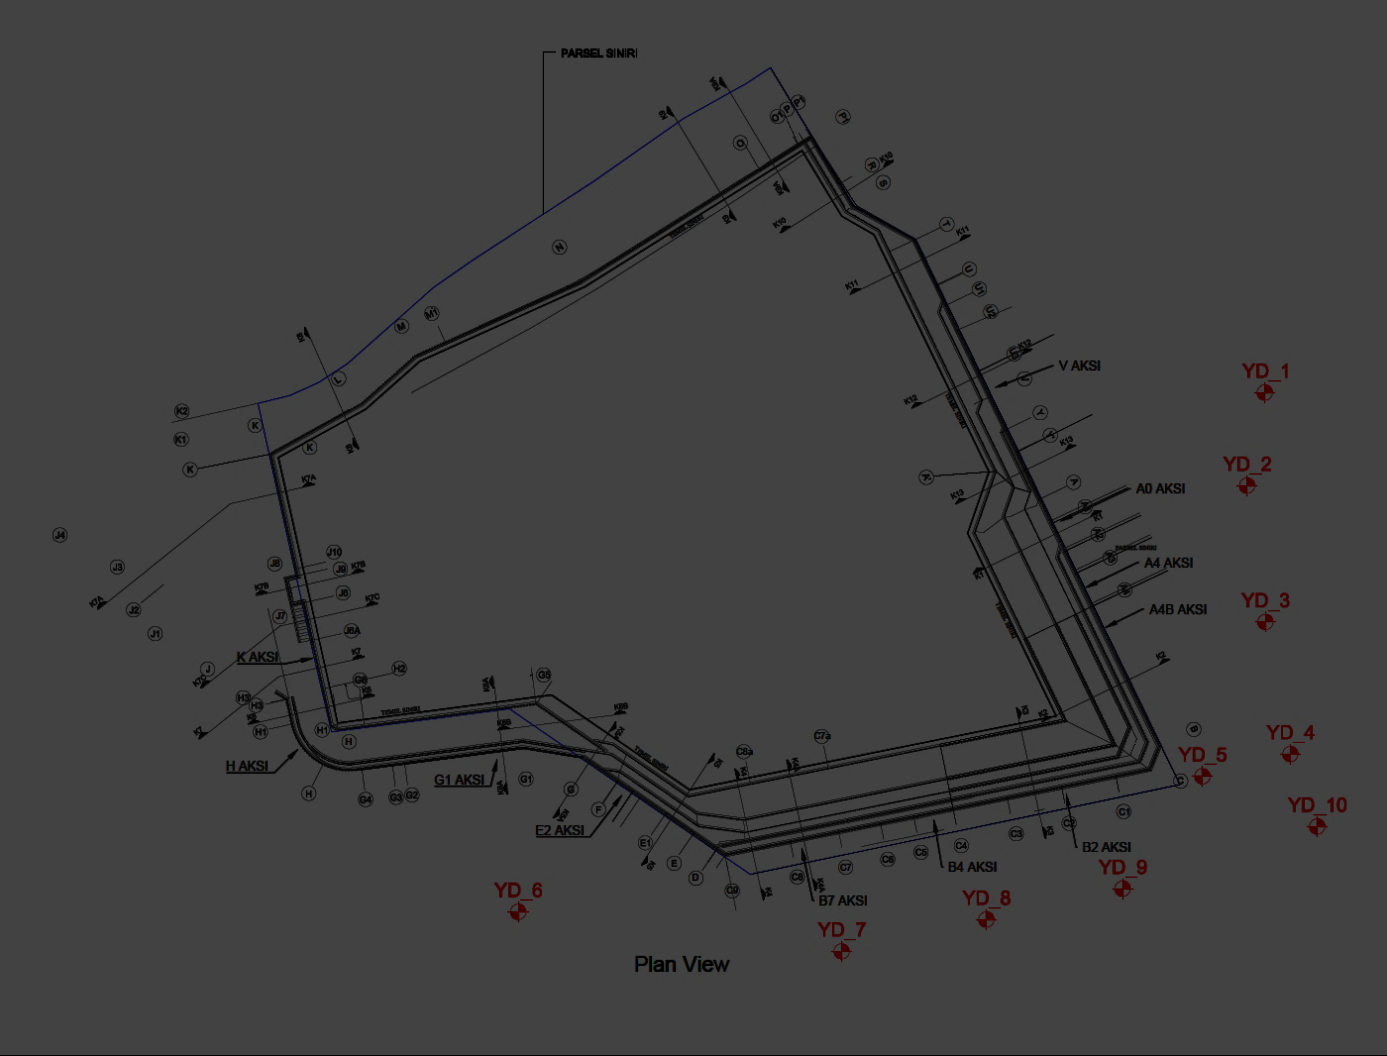
The image shows ten supplementary monitoring points set out on the main road.
The supplementary points were measured weekly with GPS. For precision, the antenna was levelled and fixed over each point using a tripod. At least 100 epochs were observed per session, with three sessions per point.
The collected data were processed on a computer. Final point coordinates were first calculated from the three sessions. Vertical changes (dz) were examined for evidence of ground movement. Geoid undulation corrections were applied to GPS ellipsoidal heights to obtain orthometric heights. These were compared with the initial project coordinates to determine deformation.
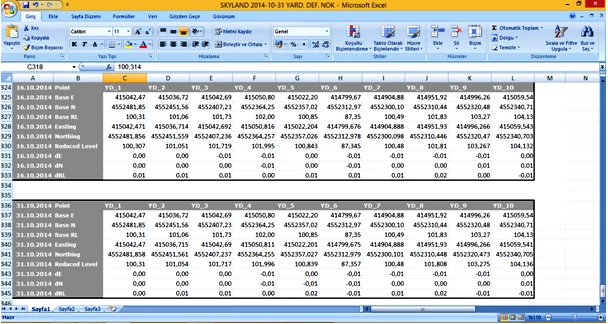
Screenshot of the file containing supplementary point positions and deformation values.
Conclusion
Results from daily observations were tracked by axis and reported in weekly plots. The number of decimal places in a result does not establish measurement accuracy. Early-warning assessments must consider measurement uncertainty, movement rate and thresholds defined by those responsible for the project.
The daily raw observations allow collimation errors to be detected, while the adjustment helps identify inconsistent measurements, providing internal checks within the system.
Following our principle of “the right method, the right equipment and the right personnel”, the project was carried out with a reliable, precise system.
Image Catalogue
