
Remotely Controlled Bathymetric Survey Craft Kordil RC
May 2010
Request a Quote for Kordil RC
Request a quote for a comparable remotely controlled survey system.
Request a QuoteKordil's First Remotely Controlled Survey Craft Kordil RC Bathymetric Survey and Report
Content has been condensed
INTRODUCTION
The survey aimed to support safe navigation for vessels entering, leaving or potentially using the area around a jetty. Contact details for the party and organisation commissioning the bathymetric survey were provided below. Because the methods and systems used differed somewhat from routine bathymetric surveys, this document sets out the work in detail and as transparently as possible. It should therefore be assessed as a whole rather than in isolated sections. Throughout fieldwork and reporting, every effort was made to include the details required for approval by SHOD, the competent approving authority.
EQUIPMENT DETAILS.
Bathymetric Survey Craft
Kordil RC is a remotely controlled surface survey craft used for depth measurement in nearshore and restricted-access areas. This archived field report describes its operation with a GNSS positioning and depth measurement system.
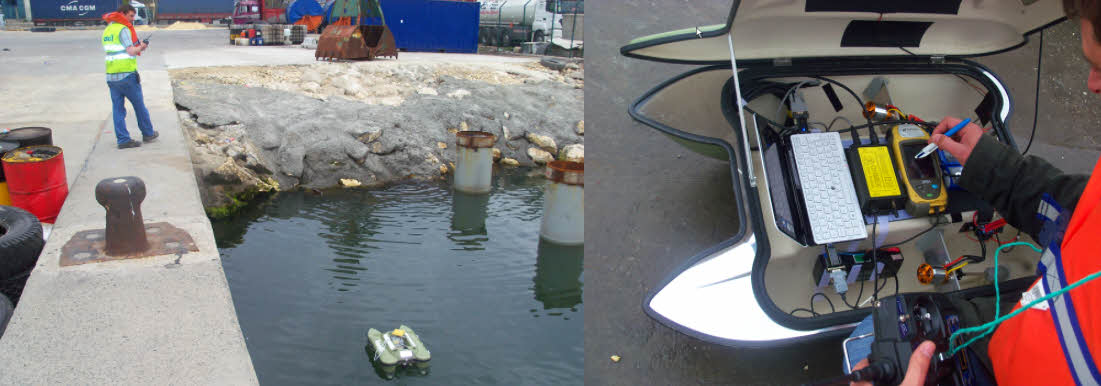
KROV KROV surveying confined areas using remote control and high manoeuvrability.
KROV carries the following equipment.
Topcon GRS-1 GNSS Receiver
Ohmex SonarM8/Mite Single-Beam Echo Sounder
Sony VAIO Computer
Inside KROV: the device beneath the pen is the Topcon GRS-1, with the Ohmex SonarM8 to its left and the Sony VAIO P Series computer at the far left.
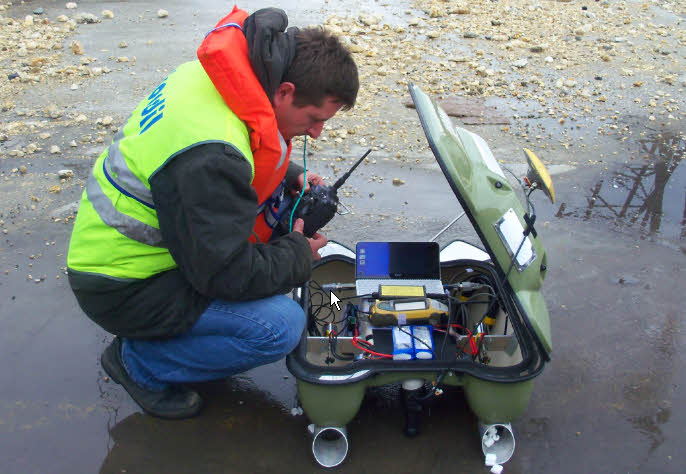
Rear view of KROV. The SonarM8 transducer can be seen at the lower centre.
Echo-Sounding System
Ohmex SonarMite/M8 is a digital echo sounder operating at 235 kHz and usable to depths of 75 m. Its intelligent transducer and bottom-tracking function output digital depths with a quality indicator over RS232 or Bluetooth. The original report describes the system as meeting IHO standards.
Positioning
The Topcon GRS-1 is a mobile, precise GNSS positioning system using the L1 and L2 bands. It also supports DGPS using EGNOS and WAAS corrections.
Sound Velocity
AML Oceanographic sound velocity instrument was used.
Data Acquisition
A Sony VAIO P Series notebook on board the craft was used for data acquisition. Further technical details were not considered necessary.
SURVEY
Offsets
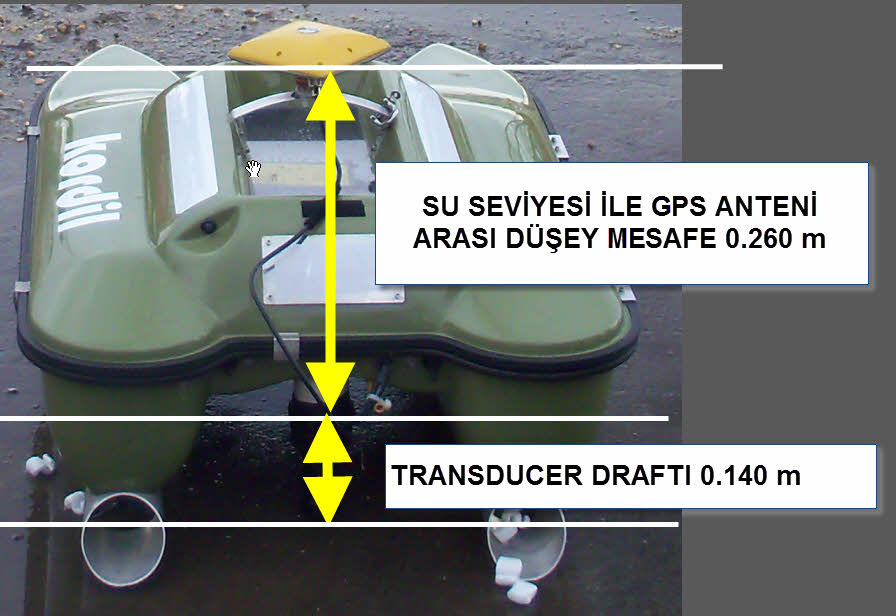
The vertical distances between the GPS antenna, water level and echo sounder transducer on KROV are shown in the illustration below.
Survey Line Spacing
Survey lines were designed at 10 m spacing. Care was taken to avoid wider gaps wherever possible, and many areas were surveyed at a higher density.
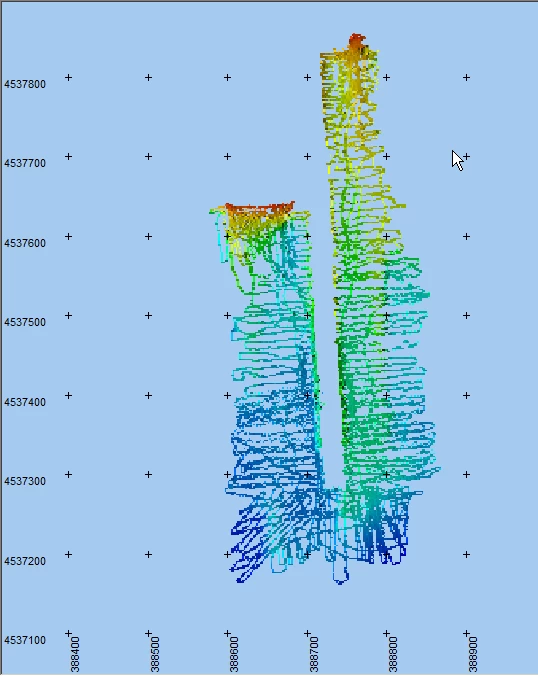
Final points loaded into the PDS2000 DTM editor. The survey lines are also distinguishable. The cyan line marks the boundary.
Survey Method
The Topcon GRS-1 was used in DGPS mode throughout the survey. Raw GPS antenna data were recorded simultaneously at one-second intervals to compensate for possible interruptions. DGPS was preferred to CORS-TR because it provided more continuous data. On the final day of work (03/05/2011), the area previously occupied by a vessel in the harbour and several remaining gaps were surveyed using RTK with CORS-TR.
The raw data were also used to calculate the mean antenna elevation and hence the water level, assuming a constant antenna height above the water. To minimise local errors, data stability and quality were assessed and the best-quality records selected for the water-level calculation.
Survey lines were followed using bearings taken from existing 10 m markings on the jetties and from the opposite jetties. Remaining gaps were subsequently filled by additional survey runs.
The incoming echo sounder and SonarMite data streams were recorded independently and simultaneously with timestamps at a resolution of 1/1000 second (milliseconds), for later processing. The simultaneous data Kordil Navigation Pro were acquired using the software.
Kordil Navigation Pro includes a terminal emulator that timestamps incoming serial-port data at millisecond resolution and records it at high speed. At the same time, it displays basic navigation information, including datum and Transverse Mercator coordinates or an unprojected view, survey lines, position and speed. Tracks already covered are marked, allowing omitted or uncovered areas to be identified when the craft is brought ashore.
The examples below show how SonarM8 and GPS data were recorded during the survey. These time-based records were subsequently processed with Kordil SonarMagic into a raw-data format.
SonarM8 Data Format
The colours in the explanations correspond to those in the data. These are actual records from the final survey day.
- Date (YYYY-MM-DD)
- Time (HHMMSSFFF)
- Sensor Number
- Depth Below Transducer
- Battery Voltage
- Data Quality Indicator
- Empty
2011-03-05 153403582 1 10.47 12.8 102 0
2011-03-05 153404081 1 10.5 12.8 95 0
2011-03-05 153404565 1 10.5 12.8 102 0
2011-03-05 153405080 1 10.53 12.8 96 0
2011-03-05 153405579 1 10.54 12.8 98 0
2011-03-05 153406078 1 10.6 12.8 95 0
2011-03-05 153406577 1 10.65 12.8 98 0
2011-03-05 153407077 1 10.69 12.8 104 0
2011-03-05 153407576 1 10.66 12.8 102 0
2011-03-05 153408075 1 10.72 12.8 102 0
2011-03-05 153408574 1 10.74 12.8 105 0
2011-03-05 153409089 1 10.77 12.8 99 0
2011-03-05 153409573 1 10.77 12.8 103 0
2011-03-05 153410072 1 10.78 12.8 103 0
2011-03-05 153410587 1 10.78 12.8 95 0
2011-03-05 153411070 1 10.78 12.8 102 0
2011-03-05 153411585 1 10.8 12.8 99 0
2011-03-05 153412069 1 10.8 12.7 102 0
2011-03-05 153412568 1 10.8 12.8 98 0
2011-03-05 153413067 1 10.83 12.8 101 0
2011-03-05 153413582 1 10.9 12.8 100 0
NMEA GGA Message
The colours in the explanations correspond to those in the data.
Date (YYYY-MM-DD)
Time (HHMMSSFFF)
NMEA GGA Message
2011-03-05 153407092 $GPGGA,123346.00,4057.9422178,N,02840.6468273,E,4,10,1.26,-2.0301,M,39.4704,M,2.0,0206*55
2011-03-05 153408091 $GPGGA,123347.00,4057.9421113,N,02840.6468362,E,4,10,1.26,-2.0495,M,39.4704,M,2.0,0206*51
2011-03-05 153409105 $GPGGA,123348.00,4057.9420153,N,02840.6468614,E,4,10,1.46,-2.0429,M,39.4704,M,1.0,0206*5D
2011-03-05 153410103 $GPGGA,123349.00,4057.9419249,N,02840.6468750,E,4,10,1.46,-2.0645,M,39.4704,M,2.0,0206*54
2011-03-05 153411086 $GPGGA,123350.00,4057.9418444,N,02840.6468845,E,4,10,1.26,-2.0517,M,39.4704,M,1.0,0206*5C
2011-03-05 153412100 $GPGGA,123351.00,4057.9417594,N,02840.6469139,E,4,10,1.26,-2.0801,M,39.4704,M,1.0,0206*57
2011-03-05 153413129 $GPGGA,123352.00,4057.9416350,N,02840.6469365,E,4,10,1.61,-2.0037,M,39.4704,M,1.0,0206*5E
DATA PROCESSING
ABOUT THE DIGITAL DATA
The digital data in Appendix 2 are numbered in processing order and underwent the following steps.
GPS records without corrections were excluded; a minimum of five satellites and a 15-degree elevation mask were applied.
Depths were filtered using the SonarM8 quality indicator, retaining values of 50 or above. Consecutive readings were also examined individually; the entire dataset was reviewed against neighbouring readings, standard deviations and the overall trend to remove potentially faulty data. All depths were corrected using measured sound velocity in water. The sound velocity measured on the final day was 1484 m/s.
Depths were reduced to the TUTGA datum using water-level elevations.
Kordil SonarMagic processed the timestamped records using time as the common parameter to calculate the position at each depth observation.
After cleaning, the data were reduced to latitude, longitude and datum-reduced depth values.
Coordinates were transformed to the TM projection and retained for preparation of the final map.
Timestamped XYZ data were imported into PDS2000. Profiles were inspected and faulty data removed. The corrected profiles were then annotated at 10 m intervals using the PDS2000 plot module in accordance with SHOD requirements.
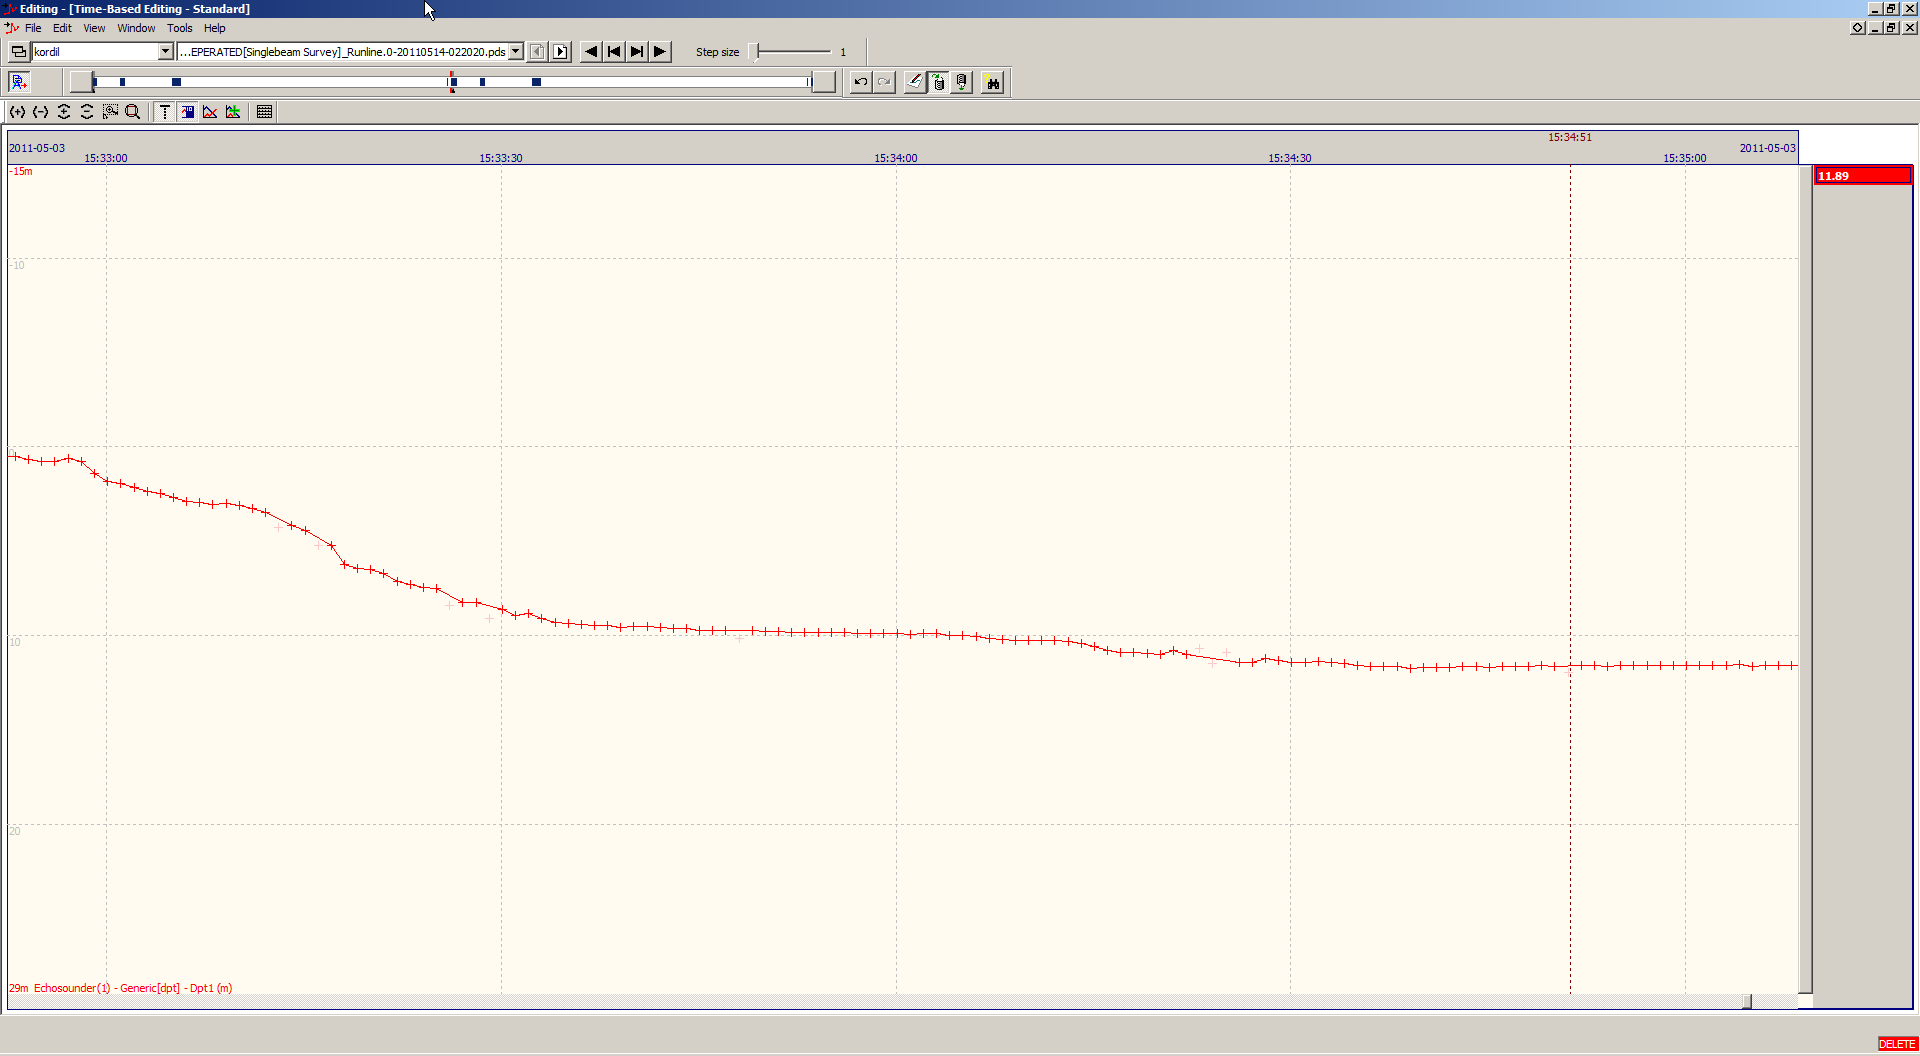
Profiles imported into PDS2000
SOFTWARE
The following software was used for data processing.
Kordil Geodesy Tools + SonarMagic: Coordinate and data-processing software based on the same sounding principles used by industry-standard applications. Primarily intended for echo sounders, it can also be used with other sensors. It calculates the position at the time an echo sounder or other instrument measurement is received, using time as the common parameter, and outputs the corresponding coordinates.
PDS2000: Hydrographic survey and processing software
Topcon Tools: GPS post-processing software
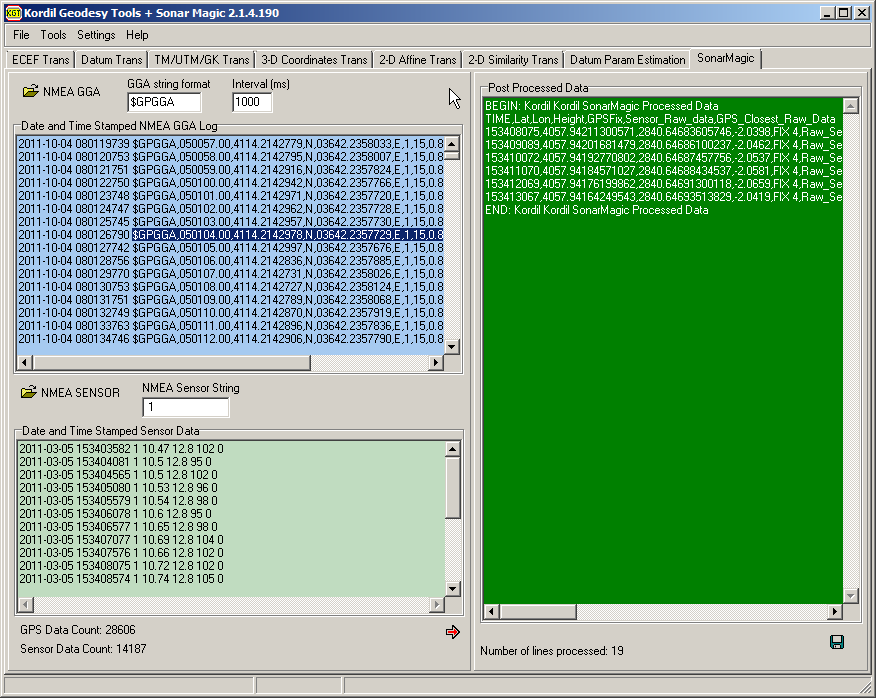
BEGIN: Kordil Kordil SonarMagic Processed Data
TIME,Lat,Lon,Height,GPSFix,Sensor_Raw_data,GPS_Closest_Raw_Data
153408075,4057.94211300571,2840.64683605746,-2.0398,FIX 4,Raw_Sensor_Begin->,2011-03-05 153408075 1 10.72 12.8 102 0,<-Raw_Sensor_End,Raw_GPS_Begin->,2011-03-05 153408091 $GPGGA,123347.00,4057.9421113,N,02840.6468362,E,4,10,1.26,-2.0495,M,39.4704,M,2.0,0206*51,<-Raw_GPS_End
153409089,4057.94201681479,2840.64686100237,-2.0462,FIX 4,Raw_Sensor_Begin->,2011-03-05 153409089 1 10.77 12.8 99 0,<-Raw_Sensor_End,Raw_GPS_Begin->,2011-03-05 153409105 $GPGGA,123348.00,4057.9420153,N,02840.6468614,E,4,10,1.46,-2.0429,M,39.4704,M,1.0,0206*5D,<-Raw_GPS_End
153410072,4057.94192770802,2840.64687457756,-2.0537,FIX 4,Raw_Sensor_Begin->,2011-03-05 153410072 1 10.78 12.8 103 0,<-Raw_Sensor_End,Raw_GPS_Begin->,2011-03-05 153410103 $GPGGA,123349.00,4057.9419249,N,02840.6468750,E,4,10,1.46,-2.0645,M,39.4704,M,2.0,0206*54,<-Raw_GPS_End
153411070,4057.94184571027,2840.64688434537,-2.0581,FIX 4,Raw_Sensor_Begin->,2011-03-05 153411070 1 10.78 12.8 102 0,<-Raw_Sensor_End,Raw_GPS_Begin->,2011-03-05 153411086 $GPGGA,123350.00,4057.9418444,N,02840.6468845,E,4,10,1.26,-2.0517,M,39.4704,M,1.0,0206*5C,<-Raw_GPS_End
153412069,4057.94176199862,2840.64691300118,-2.0659,FIX 4,Raw_Sensor_Begin->,2011-03-05 153412069 1 10.8 12.7 102 0,<-Raw_Sensor_End,Raw_GPS_Begin->,2011-03-05 153412100 $GPGGA,123351.00,4057.9417594,N,02840.6469139,E,4,10,1.26,-2.0801,M,39.4704,M,1.0,0206*57,<-Raw_GPS_End
153413067,4057.94164249543,2840.64693513829,-2.0419,FIX 4,Raw_Sensor_Begin->,2011-03-05 153413067 1 10.83 12.8 101 0,<-Raw_Sensor_End,Raw_GPS_Begin->,2011-03-05 153413129 $GPGGA,123352.00,4057.9416350,N,02840.6469365,E,4,10,1.61,-2.0037,M,39.4704,M,1.0,0206*5E,<-Raw_GPS_End
END: Kordil Kordil SonarMagic Processed Data
The red lines show coordinates calculated from GGA messages by linear interpolation to the time of each sonar reading. The nearest GGA message is retained on the same line for visual checks and gross-error detection. Depth readings without position data sufficiently close in time relative to the position update rate are excluded. To allow independent verification of the calculated coordinates, the nearest original GPS record at an appropriate interval is appended to each line. This provides a cross-check against the closest uninterpolated GPS observation for the same time period.
The timestamped records were combined in Kordil SonarMagic, and the required sound-velocity, offset and water-level corrections were applied in Excel.
The resulting XYZ data were further processed and edited in PDS2000 to produce the final map.
The following criteria were applied to the raw data:
All position records without DGPS or RTK corrections were excluded from processing.
Irregular depth readings and readings with a quality indicator below 50 were removed.
Neighbouring readings were checked using the deviation criterion stated in the original report as “0.20 cm”, with the subsequent explanation referring to 20 cm. Readings differing by more than 20 cm from the preceding or following observation were examined further and either rejected or retained for review with cross-lines on the plan.
Edited elevations were examined in profile and plan, together with contours. The resulting surface was reduced to a 5 m grid for the final map.
Final coordinates were checked again using 10 cm contours on the plan, and suspicious data without sufficient point density were removed.
The final, unsmoothed coordinates were loaded into the PDS2000 1 m × 1 m grid editor and inspected in three dimensions to identify potentially unrealistic features. No significant data requiring removal were found.
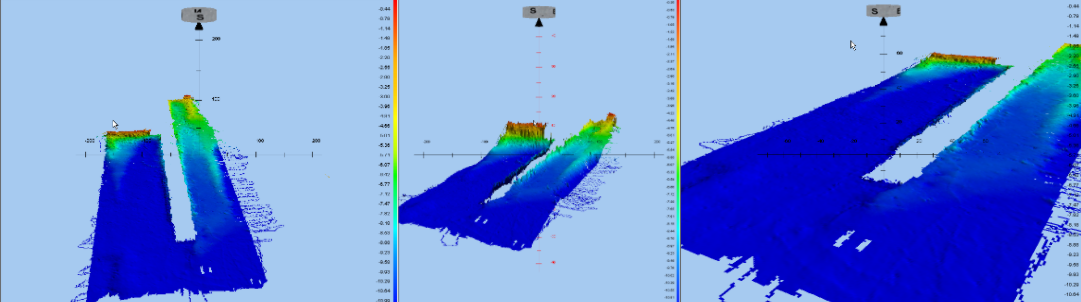
Three-dimensional views of the bathymetric data from different angles, with fivefold vertical exaggeration. The image shows a generally smooth surface. The same data without vertical exaggeration
Original survey points selected along the lines were also labelled with elevations in the bathymetric map, in accordance with the SHOD report format.
COORDINATE SYSTEM
Horizontal Reference Datum: WGS 84
CONTROL POINTS
The GNSS receiver data were processed using the nearest CORS-TR stations listed below. Station coordinates were taken from the headers of RINEX files downloaded from http://212.156.70.42/ using the account name “k*****”.
Station Cartesian Coordinates (Earth-Centred, Earth-Fixed: X, Y, Z)
KABR 4206855.6823 2301542.2908 4191502.3219
ISTN 4223661.0695 2325014.9869 4161716.1471
Station Coordinates Converted to Geographic Coordinates
Station name, latitude, longitude and ellipsoidal height are given below.
KABR 41o 20’ 49.6262’’ 28 o 40’ 57.9755’’ 93.613 m
ISTN 40 o 59’ 27.4612’’ 28 o 49’ 53.8823’’ 77.066 m
Vertical reference datum: GNSS antenna elevations were recorded throughout the survey, and hourly mean water-level elevations were calculated relative to the WGS 84 ellipsoid. Ellipsoidal heights were reduced to the map datum using geoid heights formally requested and obtained from the relevant authority at the General Command of Mapping. The calculated water levels were checked against water-level records from the nearest station, also supplied by that authority. Comparison with the Karaburun records gave reasonable differences and supported the calculated water levels.
All GPS antenna elevations were calculated with Topcon Tools post-processing software. The image below shows the adjusted points calculated for each epoch. Related calculation tables are provided in Appendix G.
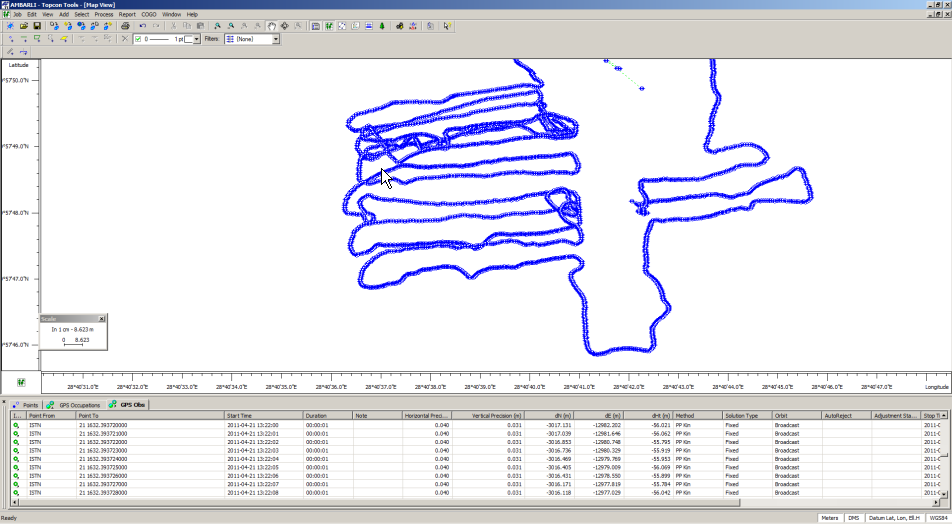
Note: Half a day of RINEX data was missing on 23 March 2011. To cover this period, RINEX records from İSKİ's UKBS system were used in a free-network adjustment to solve the kinematic data. The relevant data were supplied electronically.
UNPROCESSED RAW DATA
The raw data are supplied electronically in the relevant appendix and comprise:
Daily GPS and echo sounder records acquired in real time
Simultaneously downloaded static CORS records and static data collected by the GNSS receiver on the craft.
SURVEY QUALITY CONTROL
The following checks were performed throughout surveying and processing to control measurement quality.
A cross-line perpendicular to the day's parallel survey lines was run. Nearby seabed observations were compared, and differences were found to be within reasonable limits.
On surveys carried out on different days, additional observations were made over previously covered areas. Intersecting lines were examined and nearby points checked for possible water-level or depth-reading errors. No unrealistic or unacceptable deviations were found.
Post-processed water levels reduced to the reference datum were compared with Karaburun Station data supplied by the General Command of Mapping; no significant differences were observed. Because Karaburun was about 70 km away, the locally measured and calculated water levels were considered more representative and used in the calculations.
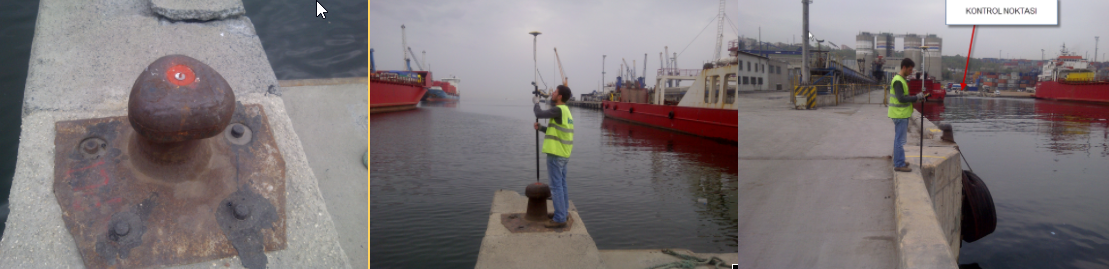
For independent checking, the coordinates of the jetty bollard shown below were measured and recorded. Its location and coordinates are given below. This point was surveyed in RTK FIX mode using CORS-TR, averaging 200 epochs (200 seconds). The coordinate system is WGS 84.
Latitude: ** **’ **.***’’ N
Longitude: ** **’ **.***’’ E
Ellipsoidal Height: **.** m
Helmert Orthometric Height: 39.821 − 36.581 = 3.24 m (36.581 is the geoid undulation supplied by the General Command of Mapping).
PERSONNEL
All surveying and processing work was carried out with the following personnel.
HK (Geodesy and Photogrammetry Engineer), Yıldız Technical University, graduated in 1995
Following graduation, he worked in photogrammetry and geodetic surveying and, from 2001 onwards, at almost every level of hydrographic surveying on major marine projects for leading international companies. At the time of the report, he had nine years of active marine and subsea experience and had spent the preceding year undertaking various subsea surveys and investigations through Kordil. His CV is attached.
MS (Surveying and Cadastre Technician), Bursa Uludağ University, graduated in 2009
Has adequate knowledge and experience in land surveying, but no substantial hydrographic survey experience.
APPENDICES
APPENDIX A: Bathymetric Maps
APPENDIX B: Source Information
General Command of Mapping Geoid Height
Karaburun Station water-level data supplied by the General Command of Mapping for checking. Because winds during the survey were from north to south, Karaburun was preferred to Yalova despite being farther away. The records were obtained by email and included in Appendix
Technical specifications of instruments and systems
Topcon GRS-1 GNSS Receiver
Ohmex SonarM8/Mite Echo Sounder
AML SmartSVP Sound Velocity Profiler
APPENDIX Ç: Field Photographs and Videos
Field Photographs
Field Videos
APPENDIX D: Horizontal Control Point Records
No additional horizontal control point was used because CORS-TR Virtual RTK and EGNOS DGPS signals were used.
APPENDIX E: Vertical Control Point Records
No levelling benchmark was used. Instead, CORS-TR stations and the geoid height supplied by the General Command of Mapping were used. Raw GNSS data were post-processed to calculate the GPS antenna elevation, and water levels were derived using the antenna height above the water.
APPENDIX F: Levelling Records
Not applicable; this method was not used.
APPENDIX G: Staff Gauge / Digital Tide Gauge Installation Sketch
Not applicable; no staff gauge was used.
APPENDIX Ğ: Water-Level Records
Daily and hourly water levels and echo sounder transducer elevations reduced to the vertical datum.
APPENDIX H: Training Certificates
Diplomas and CVs
APPENDIX I: Signature Declarations
Copies are attached; originals were presented.
APPENDIX İ: Digital Data
KROV Raw Data File
Raw data cleaned using quality criteria
Raw data with sound-velocity corrections applied to depths
Cleaned depth data reduced to the TUDKA datum
Combined GNSS and Echo Sounder Raw Output
Geographic coordinates and elevations of surveyed points
Surveyed point coordinates in the TM (Gauss–Krüger) projection